Technical Overview
Team
Organisation: King's Digital Lab
Site: https://kdl.kcl.ac.uk
Email: kdl-info [at] kcl.ac.uk
Twitter: @kingsdigitallab
GitHub: https://github.com/kingsdigitallab
Location: London WC2B 5LE, United Kingdom

Research Software Analyst: Arianna Ciula
Site: https://www.kdl.kcl.ac.uk/who-we-are/arianna-ciula/

Research Software Engineer: Miguel Vieira
Site: https://www.kdl.kcl.ac.uk/who-we-are/miguel-vieira/
Technologies and Processes
Development
For more information see development and development with docker.
Data model
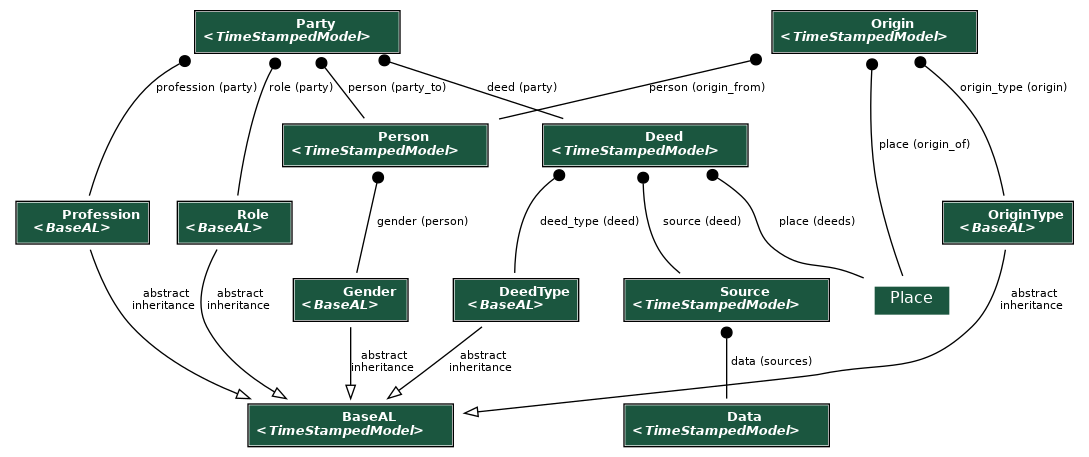
Django models
The data model graph was generated with the django-extensions graph_models command:
$ ./bake.py manage graph_models deeds -X TimeStampedModel --disable-fields --disable-abstract-fields -o models.png
Below is a very simplified example of how the model is used to record information on one deed (État Civil Ismaïlia 1872-1882).
Deed:
ID: 1; acttype: 1; n: 21; date: 24 déc. 1872; place: 1; source: 1
Person:
ID: JMS; name: Joseph Marius Silvy; year of birth: 1842
ID: TB; name: Thérèse Blaum; year of birth: 1848
Party:
Deed: 1; person: JMS; role: 2; profession: 2
Deed: 1; person: TB; role: 1; profession: 1
Origin:
Person: JMS; place: 2; originype: 1
Person: TB; place: 3; origintype: 2
DeedType:
1: Birth
2: Death
3: Marriage
Place:
1: Ismaïlia; Egypt
2: Département de la Haute-Garonne; Saint-Marcel; France
3: Département des Pyrénées-Orientales; Collioure; France
OriginType:
1: Birth
2: Origin
Profession: - 1: Sans profession - 2: Mécanicien
Role:
1: Mother
2: Father
Source:
1: Classmark: Ismaïlia 1; microfilm: P 07070
2: Classmark: Le Caire 1; microfilm: P 06505
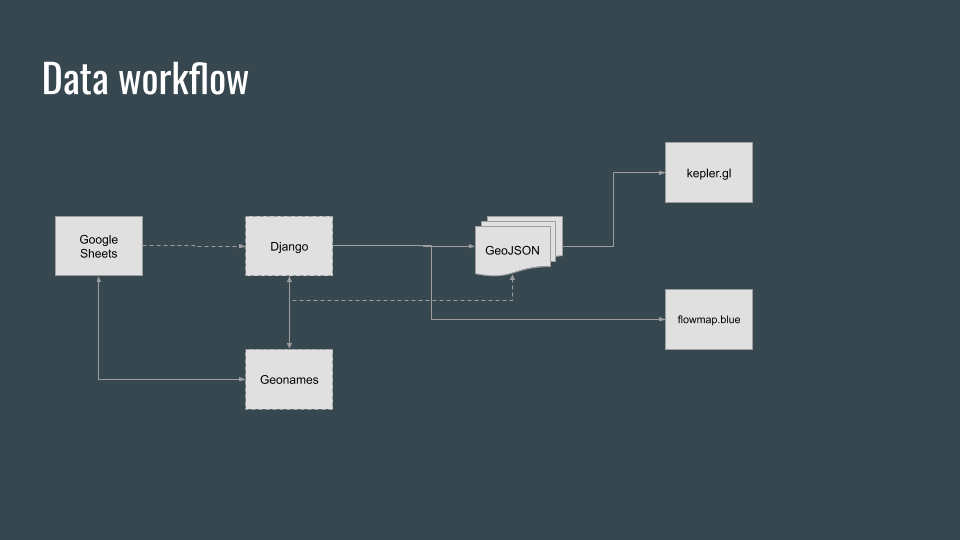
Workflows
The Django app imports data from a spreadsheet (exported from the project Google Sheet), adds geographic locations to places, and provides an admin/editing interface to manage the data (with simple filtering). After the curation and cleaning up is done in Django admin, the applicaition can export data into GeoJSON and CSV formats to support map visualisations.
Architecture
KDL built the resource using Django, an Open Source web publishing framework with which KDL has extensive experience of and has found to be stable, powerful and scalable. The Django based web platform provided functionality to upload the project dataset. With respect to the Proof of Concept, data was exported from the Django database in GeoJSON and CSV formats so as to generate maps visualisations in the tools mentioned below. The Django based web platform and related tools provides the functionality to record metadata about the archival sources under examination via an administrative interface to the resource.
To support advanced queries on the project Django database (e.g. in checking, processing, analysing and visualising the data), KDL set up Metabase (a free, stand-alone Java application that can connect to various types of databases, build queries via a user interface, browse, filter and export the results, make simple charts and visualisation and share them as cards into collections) which can be used without advanced coding knowledge (apart from SQL, if needed) and includes a REST API to export JSON/CSV results from the cards. However, this additional application has not been used as yet to analyse the data systematically.
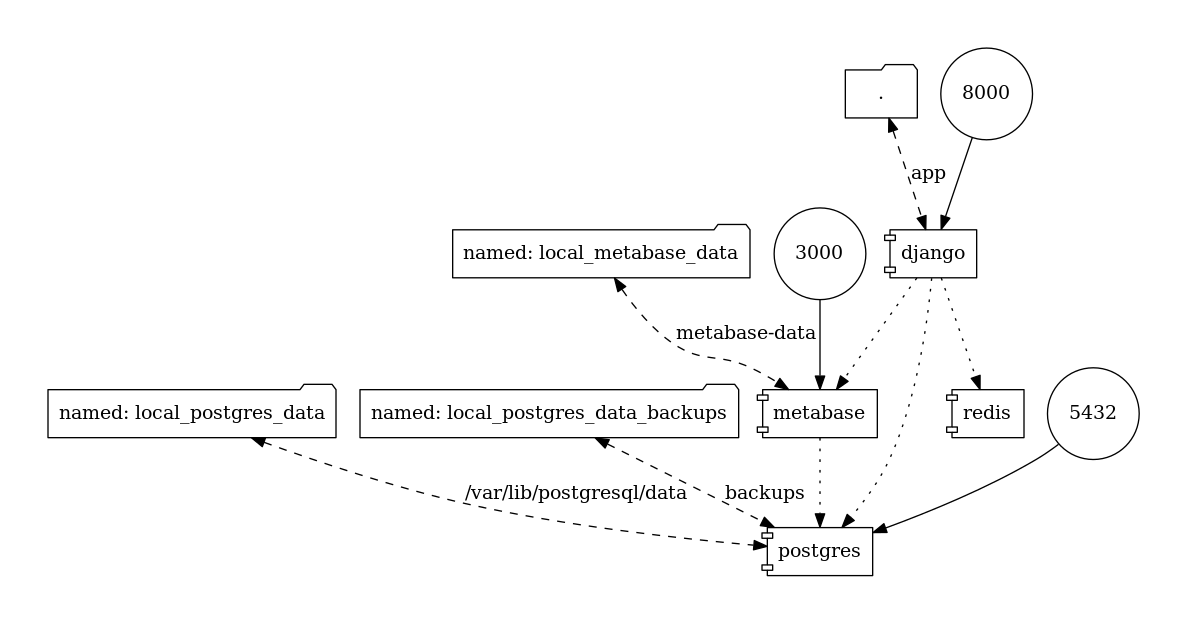
Local Docker Stack
The graphs were generated by the docker-compose-viz tool:
$ docker run --rm -it --name dcv -v $(pwd):/input pmsipilot/docker-compose-viz render -m image local.yml
Design process
The project makes uses of two existing tools to generate map visualisations:
Kepler.gl is an open source geospatial analysis tool for large-scale data sets
flowmap is a more minimal solution to create geographic flow maps from data published (not private) in Google Sheets. It allows to visualize numbers of movements between locations (origin-destination data) and explore the data interactively; however on a limited number of parameters (from, to and count). See the flowmap version based on the État Civil data.
Description of this proof of concept with historical introduction are available on the Harvard and Cambridge Centre for History and Economics Visualizing Historical Networks project website.